Radon Levels by Province: The Canada-Wide Survey Results
Last updated: By RadonIndex Research Team
What share of Canadian homes is at or above the radon guideline today?
About 1 in 5. Health Canada's survey page says the 2024 survey "found that approximately 1 in 5 (17.8%) houses in Canada have radon levels at or above the current radon guideline of 200 Bq/m³". Health Canada's radon guideline sets that line at 200 becquerels per cubic metre (Bq/m3). Health Canada's 2012 survey report calls the unit "a measurement of radioactive concentration" in the air.
The 2024 Cross-Canada Survey was written by the Evict Radon National Study team, university researchers working with Health Canada, CAREX Canada and the BC Centre for Disease Control. It pooled 69,478 long-term test results, "with 99.7% of tests occurring between 2009 and 2024". In a foreword, Health Canada says researchers "have been seeing a trend towards higher radon levels in many parts of Canada".
The figure covers detached, semi-detached and row houses; the authors had "limited data" for apartments. Condo owners can read the guide to radon in a Toronto condo.
How do the provinces compare in the 2024 survey?
The gap between regions is wide. The 2024 report sorts Canada into 5 regions first, partly to pool smaller provinces so their results can be weighted. Its regional shares of houses at or above the guideline are 33.3 percent in Atlantic Canada (Nova Scotia, New Brunswick, Newfoundland and Labrador, Prince Edward Island), 31.6 percent in the Pacific interior and the Yukon (northern and interior BC with the Yukon), 20.0 percent in the Prairies and the Northwest Territories (Alberta, Saskatchewan, Manitoba, Northwest Territories), 16.4 percent in Central Canada (Ontario and Quebec) and 1.3 percent on the Pacific coast (Vancouver Island, the Lower Mainland and the rest of coastal BC).
Provinces then get lines of their own. The report puts Nova Scotia at 36.8 percent and New Brunswick at 24.6 percent. It gives Quebec and Alberta 16.7 percent, Ontario 12.4 percent and the Yukon 23.7 percent. The BC interior is "1 in 3", also a weighted value. Other lines are "unweighted" values the authors could not yet balance. Saskatchewan and Manitoba are "approximately 1 in 3". Newfoundland and Labrador, Prince Edward Island and the Northwest Territories are each at 1 in 5. Nunavut has no figure, for lack of "sufficient radon results".
The same report warns that its results "should not be used as a tool to determine personal radon risk potential, or to decide whether to test a specific household for radon". Its authors add that there are "no areas of Canada that are 'radon-free'".
Which provinces had the most homes above the guideline in 2012?
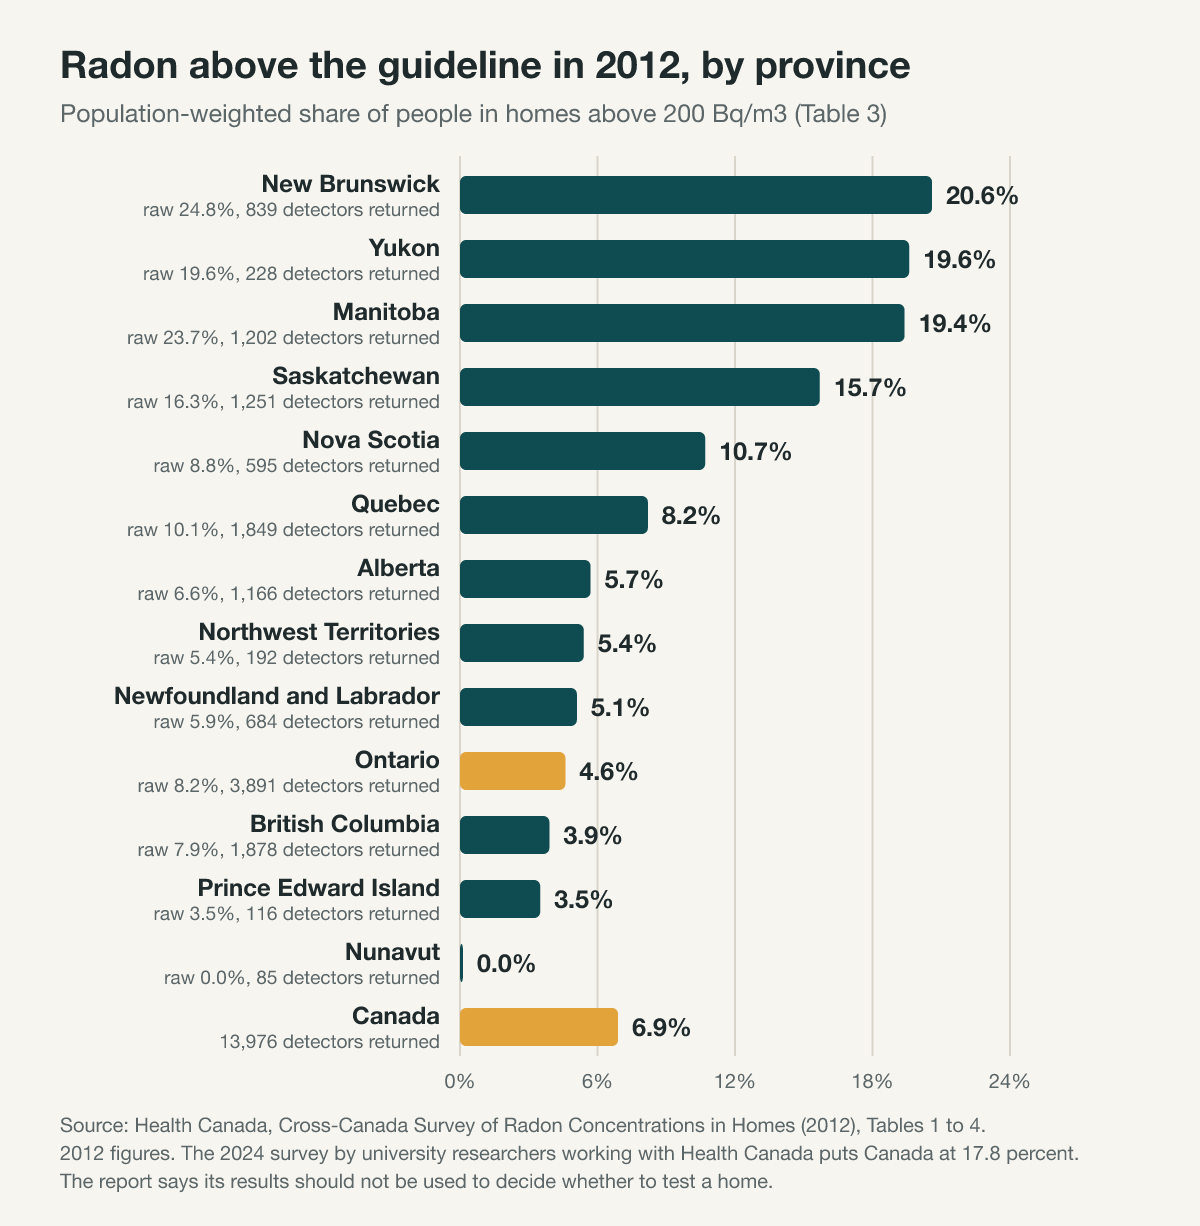
Health Canada's 2012 survey report says "Manitoba, New Brunswick, Saskatchewan, and the Yukon had the highest percentages of participant homes". It adds that "Nunavut and Prince Edward Island had the lowest percentages". The figures below draw on Tables 1 to 4 of the report. All figures are from 2012; Health Canada's page now gives 17.8 percent for Canada, and the 2024 report gives 12.4 percent of Ontario houses.
Ranked by the population-weighted share in Table 3, New Brunswick led at 20.6 percent, followed by the Yukon at 19.6, Manitoba at 19.4 and Saskatchewan at 15.7. Nova Scotia came next at 10.7 and Quebec at 8.2. Alberta at 5.7, the Northwest Territories at 5.4, Newfoundland and Labrador at 5.1, Ontario at 4.6, British Columbia at 3.9, Prince Edward Island at 3.5 and Nunavut at 0.0 made up the rest, against 6.9 percent for Canada as a whole in Table 4. The chart below adds each province's raw share from Table 2 and its returned detectors from Table 1.
The provincial rows rest on 85 to 3,891 returned detectors. The report counts 13,807 valid results out of the 13,976 detectors sent back. It says: "This survey's results should not be used as a tool to determine radon risk potential or whether or not to test a home for radon". Of the 14 health regions with raw shares from 23 to 44 percent, the report places 5 in Manitoba and 4 in New Brunswick. Another 3 were in Saskatchewan, with 1 each in Quebec and BC. A health region is the survey's term for the area run by a hospital board or regional health authority.
Nunavut's zero needs a warning. It rests on 85 detectors, and the report says a zero does not mean no home there has a high level.
What is the difference between a raw and a population-weighted share?
A raw share counts tested homes, and a population-weighted share estimates people. Health Canada's 2012 survey report calls a raw percentage "simply the number of results in a particular radon concentration category" divided by the province's total. For the weighted figure, it took each health region's raw result and applied that region's population from the 2006 Census.
The two measures can move apart. BC had a raw share of 7.9 percent but a weighted share of 3.9 percent in 2012. In 8 provinces the weighted figure is the lower one; Nova Scotia is the exception, at 8.8 raw and 10.7 weighted. That suggests its more populous health regions had higher raw shares than its smaller ones; the report does not say so itself. Prince Edward Island and the 3 territories match in both tables. The report says they each "had only one Health Region".
The 2024 authors adjusted results by region, by urban or rural community and by house type, using the 2021 Census. Lines they could not yet balance carry the label "unweighted value". They warn that such values "may increase or decrease somewhat once appropriately weighted". The 2012 table counts people and the 2024 lines count houses, so the two are not measured the same way.
Why are the 2024 figures so much higher than 2012?
Its authors do not claim a single cause. The 2024 report calls 17.8 percent "a nearly 2.5-fold increase compared to the 6.9%" from 2012, and it offers several possible reasons. One is building practice: newer, tighter houses with limited fresh-air exchange may hold more radon. Another is test location, since 68 percent of the 2024 results came from rooms below ground, against 31 percent in 2012. Energy retrofits may play a part, because sealing older houses without adding ventilation may keep more soil gas indoors. Scale and weighting differ too, with about 70,000 results in 2024 against about 14,000 in 2012 and more adjustment. So does recruitment: 2012 recruited by landline phone calls, while 2024 used many channels, including online.
The report says it "does not invalidate the previous work carried out in 2012". Health Canada's own survey page now leads with the 2024 figure, so this guide treats 17.8 percent as the current national picture. The 2012 tables still add provincial detail, always with the year attached.
Where does Ontario sit, and does it matter for one home?
Ontario is lower than most of Canada, but Health Canada recommends testing every home, no matter where it is located. The 2024 report puts Ontario at 12.4 percent against 17.8 percent nationally. It says Central Canada "has lower residential radon concentrations relative to the Atlantic, Prairie, or Pacific Interior regions of Canada". Even so, the report's own figure means about 1 in 8 Ontario houses sits at or above the guideline.
A provincial share cannot describe one house. Health Canada's radon guideline says "there is no level that is considered risk free". Health Canada's guide for radon measurements in homes recommends tests "over a period of 3 to 12 months". The steps are in the guide to testing a home in the Greater Toronto and Hamilton Area (GTHA). The guide to what Health Canada's 200 Bq/m3 guideline means explains how to read the result.
What can RadonIndex tell a household in the Greater Toronto and Hamilton Area?
RadonIndex can say who does radon work in the GTHA, not what any home reads. Of the 35 companies it lists, 31 name radon testing on their own websites and 12 name mitigation. The lists sit on the radon testing page and the radon mitigation page.
Counted from the site's records, 7 companies are listed in the Toronto area and 4 in Vaughan; see the Toronto area page. Another 12 publish no street address and serve an area instead. Of the 35, 5 say on their own website that they are C-NRPP certified. C-NRPP is the Canadian National Radon Proficiency Program, and its certificate belongs to a person. Anyone can look up a name on the C-NRPP certification check. The methodology page explains what the site reads.
Frequently asked questions
Which province has the highest radon levels?
- It depends on the survey and the measure. In the 2024 survey, Nova Scotia has the highest weighted provincial percentage, 36.8 percent of houses. The BC interior, Saskatchewan and Manitoba each come in at about 1 in 3; only the BC interior figure is weighted. In Health Canada's 2012 survey, New Brunswick led on both measures: 24.8 percent raw and 20.6 percent population-weighted. No provincial figure can rank one street or one house.
Does the 2024 survey give a figure for every province?
- No. It reports 5 regions first. Its provincial lines are weighted for Nova Scotia, New Brunswick, Quebec, Ontario, Alberta, the Yukon and the BC interior. Newfoundland and Labrador, Prince Edward Island, Saskatchewan, Manitoba and the Northwest Territories get unweighted values only. Nunavut has no figure. The authors say they aim to publish fully weighted results for all provinces in a later update.
Is the British Columbia coast free of radon?
- No. The 2024 survey puts the coastal region at 1.3 percent of houses at or above the guideline, the lowest of the 5 regions. Rural coastal communities were higher, at 3.5 percent, or 1 in 28. The authors write that the area "is by no means free of risk". The BC interior, by contrast, sits near 1 in 3.
Can my province's figure tell me whether to test?
- No. The 2024 report says its results "should not be used as a tool to determine personal radon risk potential". Health Canada's 2012 report says its tables "should never be used by a homeowner in making a decision to test their home for radon". A low provincial share still includes homes above the guideline. Health Canada recommends that every home be tested, no matter where it is located, and the guide to testing a GTHA home sets out how.